
In Tackling Extreme Heat: Recommendations for Strengthening Massachusetts Policy—AEC’s recent background report on behalf of Boston non-profit A Better City—AEC finds that historic redlining practices have left low-income and BIPOC communities in areas less equipped to handle extreme heat events. These areas are referred to as ‘hot spots’—the top 5 percent hottest areas within each of Massachusetts’ 13 Regional Planning Agency regions. In its recent report, AEC highlighted a finding from the Wicked Hot Boston project led by Museum of Science researchers that identified a correlation between previously redlined areas and higher temperatures. Wicked Hot Boston attributed this relationship largely to the absence of tree cover in BIPOC neighborhoods compared to primarily white neighborhoods.
The Home Owners’ Loan Corporation 1930s redlining data and Massachusetts 2019 heat vulnerability data developed by the Metropolitan Area Planning Council are well correlated. Communities given the lowest redlining grade (D) for the illegal and discriminatory practice of denying financial assistance for home loans based on the neighborhood tend to be located in areas with “extremely high” and “moderately high” heat vulnerability.
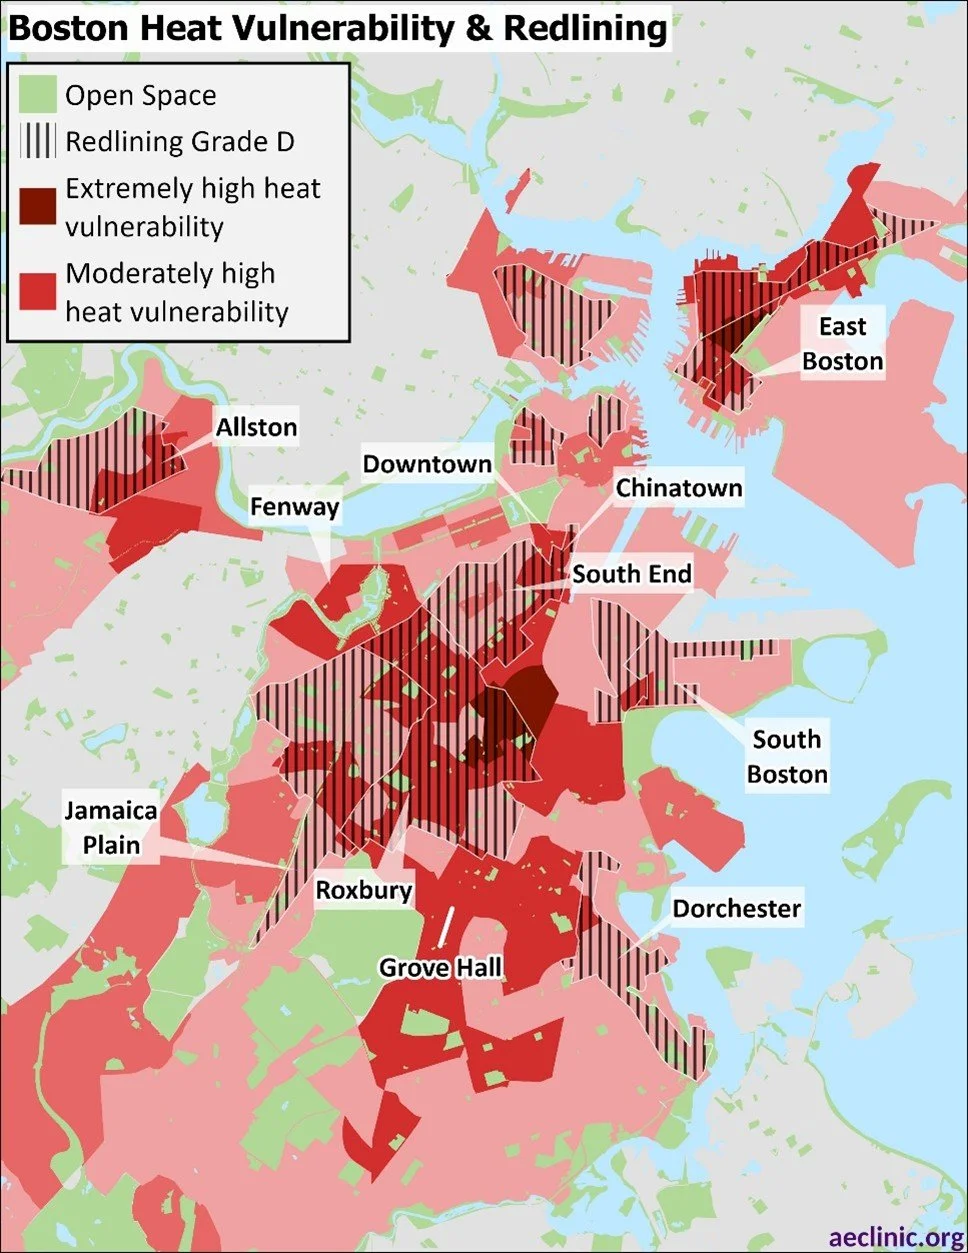
Communities with a “D” grade for redlining and both moderately and extremely high heat vulnerability are shown in this map of the Boston area. Two Boston neighborhoods—Roxbury and East Boston—experience both “extremely high” heat vulnerability and a “D” redlining grade. Several additional Boston neighborhoods experience both “moderately high” heat vulnerability and a “D” redlining grade, including Allston, Chinatown, Dorchester, Downtown, East Boston, Fenway, Jamaica Plain, Roxbury, South Boston, and the South End. Exemplifying the link between historical redlining and heat vulnerability, Grove Hall, situated between Roxbury and Dorchester, experiences significant impacts from urban heat islands, as discussed in AEC’s recent issue brief, Rooftop Coverage Alternatives: Assessing Benefits for Grove Hall.
Understanding the relationship between historical redlining and heat vulnerability can help inform efforts to address extreme heat in Massachusetts. The observed overlap between previously redlined areas and higher heat vulnerability highlights a pattern that may be relevant for future research and policy considerations.