• Home
  • About
    • Our People
    • Mission and Funding
    • 990 Filings
    • Governance and Disclosure Statements
  • Our Work
    • Publications
    • Newsletters
    • Equity Resources
  • Blog
  • Jobs
    • Internships
    • AEC Fellowship
    • Careers
  • Pro Bono Fund
    • Pro Bono Fund
    • Donate
    • MassCEC Empower Grant
Applied Economics Clinic
  • Home
  • About
    • Our People
    • Mission and Funding
    • 990 Filings
    • Governance and Disclosure Statements
  • Our Work
    • Publications
    • Newsletters
    • Equity Resources
  • Blog
  • Jobs
    • Internships
    • AEC Fellowship
    • Careers
  • Pro Bono Fund
    • Pro Bono Fund
    • Donate
    • MassCEC Empower Grant

Energy Insecurity for Renters

Source: American Council for an Energy-Efficient Economy (ACEEE). 2022. One-Third of Tenants Behind on Utility Bills, Highlighting Need for Energy Upgrades. Available at: https://www.aceee.org/blog-post/2022/08/one-third-tenants-behind-utility-bills-highlighting-need-energy-upgrades

In winter months, as temperatures begin to fall, many households in regions across the United States fall behind on their energy bill payments. Often called energy insecurity the inability to pay energy bills can lead families to take out high risk loans, forgo buying food or medicine in order to pay their energy bill, or risk unsafe measures to heat or light their homes. Renters in particular have a high likelihood of becoming energy insecure, with 33 percent of the United States’ 44 million renters struggling to pay their energy costs last year. Renters often live in older, less energy-efficient buildings, which can increase their energy burden (which means that they have to spend a higher share of their income on heating and electricity).

On top of the standard obstacles to making a home more energy-efficient, such as high costs, renters face an extra barrier: They must go through their landlord to add insulation, upgrade to more efficient appliances, or switch to high-efficiency heat pumps for heating. Given lower rental income since the onset of the COVID-19 pandemic, however, studies have shown that landlords are unlikely to make energy-efficient changes without incentives. The Inflation Reduction Act, passed in August of this year, funds new incentive programs to landlords who make energy-efficient changes to their properties.

Nicole Yang

Communications Assistant


This is a part of the AEC Blog series

tags: Nicole Yang
Thursday 12.22.22
Posted by Liz Stanton
 

Rising Prices: The Cause of Higher Heating Bills This Winter

Source: Massachusetts Department of Energy Resources. 2022. Massachusetts Household Heating Costs. Available at: https://www.mass.gov/info-details/massachusetts-household-heating-costs#comparing-heating-technologies-to-save-on-your-heating-bills-

Higher heating costs are predicted this winter by the Massachusetts Department of Energy Resources due to higher-than-average fuel and electricity prices. In the 2022/2023 Winter report, Massachusetts Household Heating Costs, the Massachusetts Department of Energy Resources predicts electricity rates to be 40 cents per kWh in the Commonwealth, compared to 27 cents last winter. The report indicates that the exact changes to heating costs will vary based on the technology used to heat the home. For example, households using heat pumps pay one third of the cost of those using electric resistance heating (see Figure 2).  

Source: Massachusetts Department of Energy Resources. 2022. Massachusetts Household Heating Costs. Available at: https://www.mass.gov/info-details/massachusetts-household-heating-costs#comparing-heating-technologies-to-save-on-your-heating-bills-

In the wake of electricity price increases, Massachusetts’ electric utility National Grid announced a 64 percent jump in residential customers electric bills this winter. According to American Council for an Energy-Efficient Economy, low-income and BIPOC households already face higher energy burdens, making them particularly vulnerable to increases in energy bills. To help mitigate the impact of rising prices, National Grid launched a Winter Customer Savings Initiative, which helps with bill management and provides payment assistances programs. Eligible homeowners and renters may also receive help with their energy bills through Massachusetts Home Energy Assistance Program. 

Jordan Burt

Research Assistant


This is a part of the AEC Blog series

tags: Jordan Burt
Thursday 12.15.22
Posted by Liz Stanton
 

Sustainable Finance: Potential and Shortcomings

Sustainable Finance, or “green finance”, refers to emerging investment decisions that incorporate an economic activity's environmental, social and governance (ESG) impacts into the overall value of an investment or project. Traditionally, investment profits have not accounted for negative externalities such as environmental impacts of operations or unfair compensation. Sustainable finance aims to stimulate positive social externalities by incentivizing consumers to invest in companies that utilize an internal sustainability framework, or corporate social responsibility objectives, to measure ESG impacts.

Source: Olsen, H.F. 2021. What is ESG? [image]. Fiduciary Trust. Available at: https://www.fiduciary-trust.com/insights/sustainable-investing/

Financial brokers like Fidelity have begun promoting green investments to help consumers navigate the sustainable finance market. On the same note, a recent study revealed a demand for ESG-conscious products, showing 50 percent of U.S. Gen Z shoppers are willing to pay more for products that they believe are produced by companies with sustainable production practices. As a reflection of this trend, global sustainable finance investments saw a 55 percent increase from 2016 to 2020 across five major financial markets. In addition, Refinitiv’s 2021 Global Risk and Compliance report, reviewing changes in the financial risk landscape, found that 43 percent of compliance and risk professionals agreed that the global pandemic has heightened the importance of ESG factors in decision making.

Source: Refinitiv. n.d. Where there’s green, there’s growth [figure]. Available at: https://www.refinitiv.com/en/resources/special-report/cop26-data-driven-approach-tackle-climate-change#cities

The sustainable finance industry faces challenges in addressing unsustainable economic growth and the neglected impacts of consumption that have been normalized by capitalism and industrialism. In addition, a study conducted by Euromoney found that regional and global leaders of sustainable finance identified challenges in standardized risk metrics, green finance incentives and a more structured approach to a full transition to green finance.

The corporate and investment bank BBVA  identified sustainable finance as an important factor in the future of finance to address environmental risks and economic impacts as consequences of climate change, but there are still bridges that need to be built to create a global financial system that considers economic and social risks while minimizing negative environmental impacts.

Jay Bonner

Assistant Researcher and Office Manager


This is a part of the AEC Blog series

tags: Jay Bonner
Tuesday 11.15.22
Posted by Liz Stanton
 

Our Loss Is Their Gain? The Societal Costs of Fossil Fuel Industry Profits

Data Sources: (1) U.S. EPA. U.S. Greenhouse Gas Inventory.  https://cfpub.epa.gov/ghgdata/inventoryexplorer/#iallsectors/allsectors/allgas/inventsect/all; (2) The World Bank. N.d. "GDP (current US$) - United States." Available at: https://data.worldbank.org/indicator/NY.GDP.MKTP.CD? locations=US; (3) The World Bank. N.d. "Oil rents (% of GDP) - United States." Available at: https://data.worldbank.org/indicator/NY.GDP.PETR.RT.ZS? locations=US; (4) The World Bank. N.d. "Natural gas rents (% of GDP) - United States." Available at: https://data.worldbank.org/indicator/NY.GDP.NGAS.RT.ZS? locations=US; (5) The World Bank. N.d. "Coal rents (% of GDP) - United States." Available at: https://data.worldbank.org/indicator/NY.GDP.COAL.RT.ZS?locations=US. (6) The World Bank. N.d. "Inflation, GDP deflator (annual %)." Available at: https://data.worldbank.org/indicator/NY.GDP.DEFL.KD.ZG.

Over the past 30 years, the total societal costs of annual emissions—based on a social cost of carbon of (inflation-adjusted) $51 per metric ton of carbon dioxide emissions—from the U.S. economy have remained relatively steady, between $250 and $300 billion per year. In contrast, U.S. coal, oil, and gas industry profits have experienced substantial ebb and flow over the same period, ranging from a high of $335 billion in 2008 to a low of approximately $33 billion in 2015. Despite fluctuations in industry profits, for every year except 2008, annual societal costs exceeded annual industry profits, indicating a disconnect between fossil fuel companies’ market performance and the societal costs inflicted by their activities.

To reinforce this point, the cumulative value of societal costs (the total area under the red line in the above figure) is more than double the magnitude of the cumulative industry profits (the total area under the black line): Across the last 30 years, cumulative societal costs of U.S. emissions have amounted to $8.4 trillion while cumulative U.S. fossil fuel industry profits add up to $4.1 trillion.

According to House Committee on Oversight and Reform Chairwoman Carolyn B. Maloney, fossil fuel corporations continue to profit—bolstered by U.S. government subsidies and tax credits that amounted to roughly $662 billion in 2020 alone—while actively lying to the public about their stated commitments to addressing the climate damages their own activities have caused.

Despite the fossil fuel industry’s financial dependency on public dollars, the public cost of the industry far exceeds its profitability.

Sachin Peddada

Assistant Researcher

Elisabeth Seliga

Assistant Researcher


This is a part of the AEC Blog series

tags: Sachin-Peddada, Elisabeth Seliga
Monday 10.24.22
Posted by Liz Stanton
 

The Benefits of Trees for Temperature Reductions

Data source: Speak for the Trees Boston. 2016. “Exploring Tree Equity in Boston.”

Heat Islands are pockets of high temperatures created by infrastructure, such as roads and buildings, that absorbs and re-emits the sun’s heat. Heat islands are typically found in urban areas, where less greenery is available to deflect sun rays. The Applied Economics Clinic’s recent report, Boston Tree Equity Analysis, indicated that the average summer temperature is higher in the City of Boston, Massachusetts, where there is a lower percent of area covered by trees, known as a “tree canopy”. Trees, and other greenery, can help to reduce heat islands and energy use, by providing shade in warmer climates and acting as windbreakers from cold winter winds. Trees and vegetation also provide other benefits for communities, such as reducing air pollution, sequestering carbon, and reducing road maintenance costs.

Boston’s Open Space and Recreation Plan has goals for investing and improving Boston’s open spaces over the next seven years. One of the goals of this Plan is to increase the number of trees in the City to reduce the heat island effect. Requests can be made for trees to be planted by calling Parks and Recreation services, or by using the Boston 311 app, but the City recommends reviewing the requirements for tree locations before doing so.

Jordan Burt

Research Assistant


This is a part of the AEC Blog series

tags: Jordan Burt
Thursday 10.20.22
Posted by Liz Stanton
 

New Jersey Power Plants and Equity

New Jersey’s overburdened communities house 30 gas- and oil-fired power plants, almost half of the State’s total fossil fuel plants. Ten percent of schools in overburdened communities are within a mile of a fossil fuel plant compared to just 3 percent for non-overburdened communities.

According to a story map developed by the New Jersey Climate Change Resource Center, the State’s overburdened communities tend to overlap with those that face significant energy burdens (the share of household income spent on energy costs). This means that the communities that bear the brunt of pollution from fossil fuel-fired plants also face the steepest energy costs.  

One way to address these inequities is to support overburdened communities through well-paying job opportunities. There are thousands of clean energy jobs in New Jersey counties that house large numbers of overburdened communities (e.g., Middlesex and Bergen County). Unfortunately, there are significant barriers to green jobs for marginalized groups.

Overcoming barriers to participation in the clean energy industry can provide these communities with better opportunities while improve equity within New Jersey’s energy sector.

Tanya Stasio, PhD

Researcher


This is a part of the AEC Blog series

tags: Tanya Stasio
Thursday 08.11.22
Posted by Liz Stanton
 

The Decarbonization S-Curve

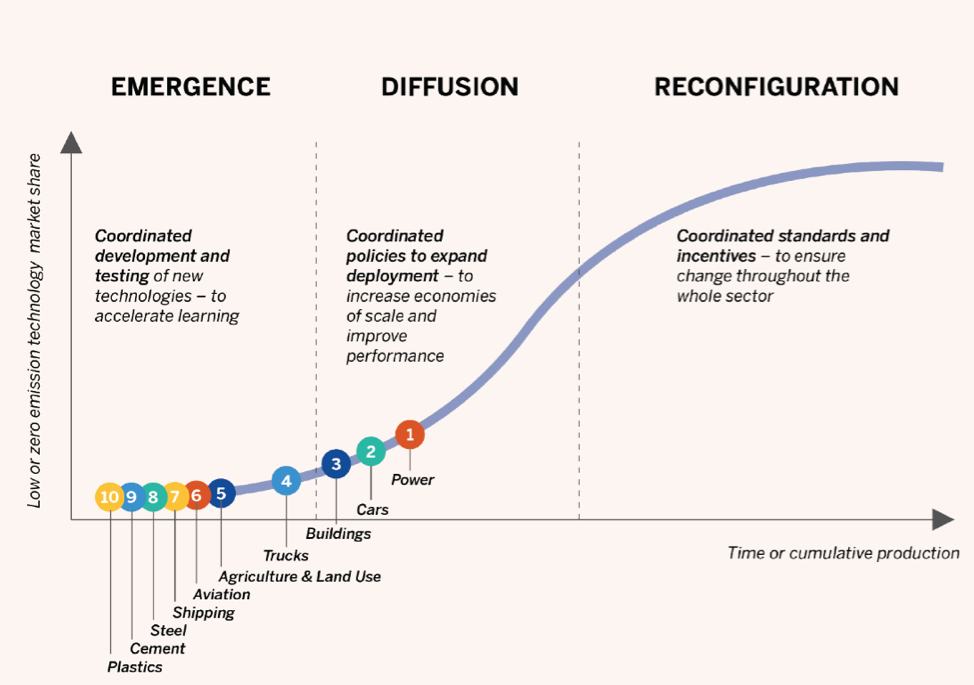
Reproduced from: Victor, D., F. Geels, and S. Sharpe. 2019. Accelerating the Low Carbon Transition: The case for stronger, more targeted and coordinated international action. Brookings. Available at: https://www.brookings.edu/wp-content/uploads/2019/12/Coordinatedactionreport.pdf. Pg. 14.

The Decarbonization S-Curve illustrates the pace at which zero emission technologies are adopted, which is neither smooth nor steady. Consequently, neither are emission reductions. The graph’s horizontal axis shows time, and the vertical axis indicates how widely used the technology becomes. Adoption is slow at first; the unproven technology struggles to find investors. As government investment, research and development spending, and other subsidies begin, adoption picks up as more firms invest to earn profits from selling the technology. Finally, the takeoff proceeds rapidly as new markets and industries develop, before slowing down as the market matures. It is in the takeoff stage at which the pace of emissions reduction is at its fastest. According to a study published in Research Policy on green technologies in Austria, the takeoff stage can only happen when politics and policy work effectively with the new technology.

In other words, the takeoff of emissions reduction from new technologies does not happen automatically and can be stopped. For example, administrative hurdles to connecting solar and storage projects to the electric grid could result in long waiting times. A shortage of charging stations or battery materials could hamper electric car purchases. According to a report by Brookings, to achieve ambitious emissions reductions governments must pursue R&D policies in the early stages, use capital grants and investment in the takeoff stage, and anchor the market with regulations and standards by the final stage—. If these problems are not addressed, we might find that progress towards our climate goals grinds to a halt. Just because emission reductions can be quick, it does not mean they will be.

Chirag Lala

Researcher


This is a part of the AEC Blog series

tags: Chirag Lala
Tuesday 08.09.22
Posted by Liz Stanton
 

Current Clean Energy and Emission Reduction Goals

Map 1. Clean energy and emission reduction goals across the United States.

Data sources: (1) National Conference of State Legislators. August 13, 2021. “State Renewable Portfolio Standards and Goals.” Available at: https://www.ncsl.org/research/energy/renewable-portfolio-standards.aspx. (2) Center for Climate and Energy Solutions. Last updated March 2021. “U.S. State Greenhouse Gas Emissions Targets.” Available at: https://www.c2es.org/document/greenhouse-gas-emissions-targets/. (3) Clean Energy States Alliance. N.d. “100% Clean Energy Collaborative –Table of 100% Clean Energy States.” Available at:  https://www.cesa.org/projects/100-clean-energy-collaborative/table-of-100-clean-energy-states/. Map last updated July 2022.

Currently, 32 states and the District of Columbia (DC) have renewable portfolio standards (RPS), standards that require a specific percentage of renewable energy in an electricity sale. Twenty-six states and DC have emission reduction targets , 18 states and DC have clean energy targets, and 21 states and DC aim to achieve either a 100 percent emission reduction or a 100 percent clean energy goal.

 In response to climate change, emission reduction and clean energy goals have become increasingly common, and many states that have adopted RPS do not yet have either an emission reduction or a clean energy goal. The first RPS policy can be dated back to 1983 when Iowa passed the Alternative Energy Production Law, which required the state’s investor-owned utilities to purchase an average of 105 megawatts of electricity from renewable energy sources. It was not until twenty years later that Maine enacted the nation’s first greenhouse gas emission reduction legislation in 2003. According to an article in The Energy Journal, states that have adopted RPS policies were likely driven by factors like “strong renewable potential, a restructured electricity market, a small share of natural gas in the electricity fuel mix, strong Democratic presence in the state legislature, and organized renewable energy interests.” This may explain why some states have adopted RPS policies but not yet emission reduction or clean energy targets: RPS legislation can be driven by politics, private interests, or renewable energy potential.

Grace Wu

Research Assistant


This is a part of the AEC Blog series

tags: Grace Wu
Friday 07.29.22
Posted by Liz Stanton
 

Peaker Plant Pollution: Ways to Beat the Peak

Reproduced from: PSE Healthy Energy. 2020. “Massachusetts Peaker Power Plants: Energy Storage Replacement Opportunities”. Available at: https://www.psehealthyenergy.org/wp-content/uploads/2020/05/Massachusetts.pdf

Massachusetts is home to 23 peaker plants across the Commonwealth. “Peaker” plants are electric generators that are called upon during times of maximum customer demand, which typically occurs between 4 PM and 9 PM on weekdays. Peakers produce the highest levels of emission when run compared to other plants on the grid, as they are often older and many use more emissions-intensive fossil fuels like oil, making them less efficient and more costly to operate. Emissions from these plants are linked to a variety of adverse health effects, like asthma and respiratory symptoms.

As hot temperatures, and other extreme weather, lead to spikes in energy demand, Massachusetts will see increasingly higher electric demand on hot summer days. However, there are steps consumers can take to reduce peak demand and associated peaker plant pollution. Text and email alerts such as Shave The Peak from the Green Energy Consumer Alliance or the Metropolitan Area Planning Council’s Peak Electricity Demand Notification program let consumers known when it’s a peak days so that they can reduce energy use. Mass Save, a Massachusetts initiative aimed at helping residents with energy efficiency improvements, offers rebates to control household smart thermostats during peak times to help reduce demand. Consumers can also help reduce the peak by shifting when they use appliances, charging electric cars off peak, and generally reducing electricity consumption during peak windows.

Jordan Burt

Research Assistant


This is a part of the AEC Blog series

tags: Jordan Burt
Wednesday 07.20.22
Posted by Liz Stanton
 

Carbon Emissions and the Courts: The Impacts of the Supreme Court's Decision in West Virginia v. EPA

Chart: Emily Barone. Source: EIA. Retreived from https://time.com/6192800/supreme-court-epa-emissions-ruling/

On June 30, 2022, the Supreme Court delivered a ruling that had long been awaited by climate advocates, policymakers, and industry. The Court voted 6-3 in favor of West Virginia in the case West Virginia v. EPA, effectively ending the EPA’s ability to regulate carbon emissions from power plants through the Clean Air Act.

The ruling significantly impedes the Biden Administration’s goal of reducing carbon emissions by approximately 50 percent from 2005 levels by 2030 and achieving zero carbon emissions by 2050. Meanwhile, the effects of climate change are increasingly evident: storms are becoming stronger and more intense, droughts are exacerbated by climate-driven weather pattern changes, and scorching heatwaves are becoming more common even in summer months.

Following the COVID-19 shutdowns in 2020, national greenhouse gas emissions continue to rise (see graph above) after years of trending downward, and the Supreme Court’s ruling poses yet another hurdle to reducing U.S. greenhouse gas emissions. The confluence of increasingly frequent climate change-driven weather events, increasing carbon emissions, and the reduced ability to regulate carbon emissions from power plants will disproportionately impact underserved and under-resourced communities. A 2021 EPA report found that predominantly Black communities are at the highest risk of experiencing the most negative health and environmental threats posed by climate change, and it also found that predominantly Hispanic and Latinx communities are more likely to be exposed to increasingly frequent extreme temperatures and coastal flooding. The window of opportunity to mitigate the worst effects of climate change is rapidly closing, and there is not a minute to waste.

Levi Bevis

Communications Assistant


This is a part of the AEC Blog series

tags: Levi Bevis
Wednesday 07.13.22
Posted by Liz Stanton
 

The Intersectional Implications of Illegalizing Abortion

The life-threatening and life-altering consequences of abortion bans are not limited either to woman-identifying or to cis individuals. Overly simplistic binaries like male and female or man and woman leave out the 12 percent of U.S. transgender men and nonbinary individuals who experience pregnancy and the 21 percent of pregnant trans and nonbinary people who receive abortions—higher than the overall 18 percent of all pregnant people nationwide who receive abortions. Not only do rigid gender binaries ignore the unique barriers and obstacles faced by pregnant trans and nonbinary people, but they also ignore race-based inequities in maternal health outcomes wherein Black and Indigenous people have a maternal mortality rate up to 3 and 4.5 times the rate for white people, respectively.

Recent research from the National Institutes of Health also reveals that disabled people face 11 times the risk of death during pregnancy compared to their nondisabled counterparts. Research in the journal Social Science and Medicine finds that among pregnant immigrants, undocumented patients are among the least likely to receive prenatal care; consequently, a 2007 study in the Journal of the American Medical Association finds that among Emergency Medicaid recipients—99 percent of whom are undocumented—childbirth and pregnancy complications accounted for 82 percent of all spending and 91 percent of all hospitalizations.

In the case of forced pregnancies due lack of access to a medical abortion, the resulting mortality will disproportionately affect trans, Black, Indigenous, disabled, and undocumented pregnant people. Research published in Duke University Press predicts that, under an abortion ban, overall maternal mortality is expected to increase by 21 percent and Black maternal mortality will skyrocket by 33 percent.

Given that low-income women are 3 times more likely than wealthier women to experience an unintended pregnancy, the deaths and other harms associated with forced pregnancy will fall along stark class-based lines.

Source: Reproduced from University of California, San Francisco (UCSF) Medical Center, Bixby Center for Global Reproductive Health. 2018. Socioeconomic outcomes of women who receive and women who are denied wanted abortions. Advancing New Standards in Reproductive Health (ANSIRH). Available at: https://www.ansirh.org/sites/default/files/publications/files/turnaway_socioeconomic_outcomes_issue_brief_8-20-2018.pdf

A landmark 2018 study conducted by researchers at the University of California, San Francisco finds that over half of all U.S. abortion-seekers live below the federal poverty level and over three-quarters do not have enough money to cover their own basic living expenses. The most common reason given for wanting to terminate an unwanted pregnancy is not having enough money to care for a child or support another one. People who are denied abortions are more likely than those who receive an abortion to become enrolled in public safety net programs like TANF, SNAP, and WIC, and are 3 times more likely to be unemployed six months later. People denied abortions are more likely to raise children as a single parent compared to those who receive abortions and are also more likely to be unable to afford their own basic needs.

The UCSF study results also suggest that forced childbirths impose significant financial duress on pregnant people, particularly for low- and moderate-income people and those in precarious economic situations; follow-up research by the National Bureau of Economic Research confirms that being denied an abortion creates significant and persistent financial burdens. It is disproportionately low-income people who will suffer the most—not just physically, but also economically—under an abortion ban.

The data are clear: The struggle for reproductive rights goes beyond a struggle for women’s rights. Reproductive justice is justice for transgender and nonbinary people, Black people, for Indigenous people, for disabled people, for undocumented people, for poor people, and for all people engaged in the struggle for bodily autonomy.

Sachin Peddada

Assistant Researcher


This is a part of the AEC Blog series

tags: Sachin-Peddada
Thursday 07.07.22
Posted by Liz Stanton
 

It’s Getting Hot in Here: Impacts of Drought

Reproduced from: National Oceanic and Atmospheric Administration. 2022. “Drought Monthly Outlook.” Data Snapshots. Available at: https://www.climate.gov/maps-data/data-snapshots/data-source/drought-monthly-outlook

This Summer, as temperatures rise and precipitation decreases or remains unchanged, much of the western half of the Lower 48 is at high risk for intense drought. According to the National Oceanic and Atmospheric Administration’s (NOAA) monthly drought outlook, conditions are forecasted to improve or stay the same on the Atlantic coast and parts of the Great Plains and Pacific Northwest regions due to below-normal temperatures and above normal precipitation through June 2022, but while conditions in the rest of the continental United States worsen.

Persistent or worsening droughts can cause decreased streamflow, dry soils, and large-scale death of vegetation. These conditions increase the potential for wildfires that spread more rapidly, burn more severely, and are more costly to suppress. Based on the National Integrated Drought Information System’s (NIDIS) recommendations, prescribed burns can reduce the potential for wildfires by thinning the amount of vegetation available to ignite. However, with this method, local air quality deteriorates severely. In regions with large swaths of farmland that are vulnerable to wildfires, like the San Joaquin Valley in California, poor air quality from agricultural burns is particularly harmful for residents’ respiratory health. While wildfire prevention and coordinating evacuations are crucial in drought conditions, there is a long-term need to consider how the related damage to air quality will affect millions of people this Summer and in the coming decades.

Sagal Alisalad

Assistant Researcher


This is a part of the AEC Blog series

tags: Sagal Alisalad
Wednesday 06.22.22
Posted by Liz Stanton
 

Energy Burden Transparency in the Housing Market

Reproduced from: Sussman, R., Bastian, H., Conrad, S., Cooper, E., Tong, E., Sherpa, A. and Porfalatoun, S. 2022. Energy Labels Affect Behavior on Rental Listing Websites: A Controlled Experiment.  American Council for an Energy-Efficient Economy. Available at: https://www.aceee.org/sites/default/files/pdfs/b2204.pdf

Low-income households face disproportionately higher energy burdens compared to households with higher incomes, in part because low-income housing tends to be more energy inefficient (i.e., relying on old heating systems, poor insulation, and less efficient appliances). 

A recent study by the American Council for an Energy-Efficient Economy (ACEEE) found that renters are more likely to choose apartments with better energy scores (a measure of building energy efficiency that ranges from 1 to 10) when energy score information is provided. For example, those looking for rental units at or below $750 per month were willing to pay 1.5 percent more in rent (about $11 more) for a one point increase in energy score.

Apartments with high energy scores save tenants money and reduce their energy burden through cheaper energy bills. Encouraging landlords, or even better, requiring them to transparently report energy costs in rental listings, would allow renters to make informed decisions, reducing energy burden for low-income households and increasing energy savings in the process.

Tanya Stasio

Researcher

Jordan Burt

Research Assistant


This is a part of the AEC Blog series

tags: Tanya Stasio, Jordan Burt
Thursday 06.16.22
Posted by Liz Stanton
 

Segregation, Migration, Displacement: The Dynamics of Gentrification in Boston

Source: Enwemeka, Z., Ma, A., and Datar, S. March 31, 2022. “Boston gets billions in home loans, but white areas get ‘much bigger piece of the pie.’” WBUR. Available at: https://www.wbur.org/news/2022/03/31/boston-home-lending-neighborhood-data

Gentrification is a process that unfolds in three stages: segregation, migration, and displacement. Until redlining was banned in 1968, Black communities in Boston and across the United States were legally segregated from white ones and structurally impoverished due to the economic legacies of chattel slavery. In the decades since the Fair Housing Act was passed, white people have begun to move into formerly redlined neighborhoods, taking advantage of relatively cheaper housing prices and a tenfold racial wealth gap, and claiming a disproportionate share of home loans. The influx of wealthier white residents into majority-minority communities drives up housing prices, pricing people out of their own neighborhoods.

In neighborhoods like Dorchester and Roxbury, where white residents claim two to three times their population share in home loans, the socioeconomic changes associated with gentrification are inextricably paired with notable shifts in racial demographics as communities of color struggle to keep up with the rising costs of living in their own neighborhoods.

There are clear signs of gentrification in Boston, and they’re hard to miss—they have “For Sale” written all over them.

Sachin Peddada

Assistant Researcher


This is a part of the AEC Blog series

tags: Sachin-Peddada
Thursday 06.16.22
Posted by Liz Stanton
 

Breaking Down National Responsibility for Climate Breakdown

Under a global economic system predicated upon endless growth on a planet with finite resources, there exists a fundamental contradiction between resources and wealth. While wealthy individuals in wealthy nations profit from the exploitation and overconsumption of the world’s natural resources, the rest of the world suffers the consequences.

Climate change has quickly evolved into a climate crisis. As acknowledged by world leaders such as the U.N. Secretary General, urgent, transformative action is required by the end of this year to avert utter catastrophe. The U.N. International Resource Panel estimates that overuse of natural resources is responsible for more than 90 percent of ecological destruction, biodiversity loss, and resulting human health damages. A recent study by economic anthropologist Jason Hickel published in The Lancet found that, as of 2017, the world economy consumes 90 billion tons of materials (including biomass, metals, minerals, and fossil fuels) per year, far exceeding the sustainable yearly limit of 50 billion tons of consumption set by the U.N. Industrial Development Organization and other industrial economists.

The Lancet study quantifies national responsibility for global excess material use, estimating that the United States and other high-income nations are responsible for 74 percent of global excess material use. While mean wealth per person in the Global North is more than six times that in the Global South, the South is left bearing 82-92 percent of the economic and social costs and 98-99 percent of deaths associated with climate change, according to Hickel’s recent research. The material benefits of resource extraction are realized in the North, while damages of that extraction are offshored to the South.

Hickel’s work reveals that central to this dynamic is unequal exchange, or an unfair trade balance, between the North and South. Today, unequal exchange results in a net extraction of value (in the form of labor, resources, and commodities) amounting to roughly $10 trillion each year, which is 30 times the amount of net aid the North sends to the South, in terms of global average prices. Hickel’s study also finds that, on average, people in the North consumed 27 tons of materials (water, food, and natural resources) in 2015, roughly four times the sustainable per capita consumption threshold of 7 tons of materials, based on a total resource consumption limit of 50 billion tons per year and a global population of approximately 7.3 billion in 2015. According to Hickel’s research, almost six-tenths of excess consumption in the North is made possible only by the extraction of value from the South.

The blame for the climate crisis, however, is not shared evenly by all individuals in all high-income countries. A complete understanding of climate accountability must include major domestic and transnational power structures and relations, such as class, race, gender, and indigeneity, which determine and affect the perpetrators, material impacts, and human tolls of environmental injustices. For instance, to imply that all residents of the United States are equally culpable for the nation’s ecological damages is to disregard the nation’s extensive history of settler-colonialism, Indigenous genocide, racialized slavery, and economic violence. All of these injustices continue to disproportionately harm minoritized and disenfranchised peoples within the United States in ecological, economic, and health outcomes.

For example, the U.S. food supply and distribution chain wastes 31 percent of all food that passes through it, while more than 10 percent of the U.S. population is food-insecure, consisting predominantly of poor, Black, Latine, and other marginalized children and adults. Moreover, communities situated near resource extraction sites, including pipelines, refineries, and mines, face staggering health disparities nationwide, including astronomical rates of cancer, asthma and chronic respiratory illnesses, and premature death, particularly—again—among low-income and racialized populations.

Both within and between countries, the global economic system produces different versions of the same hierarchies of inequitable ecological, environmental, and human harms; a privileged minority commit the greatest offenses and reap the greatest benefits, while the global masses suffer the worst of the consequences. According to a 2020 study from Oxfam International, the richest 1 percent of individuals worldwide—approximately 76 million people—now own twice as much wealth as the poorest 90 percent of the population, some 6.9 billion people. Research from the OECD shows that the world’s poorest residents suffer the worst effects of climate change.

Both the extreme wealth of the few and the suffering of the many are owed to the same root causes of resource exploitation and waste. Nature’s 2020 Scientists’ warning on affluence states clearly that the world’s wealthiest citizens are responsible for the most environmental harm and warns that the current system based on endless economic growth is not tenable.

To date, political and economic forces have fueled global society’s acceleration toward climate collapse, enabling a select minority to accumulate unprecedented levels of wealth at the expense of the majority—and of the planet itself. The world economy’s existing wasteful practices of resource extraction and oppressive hierarchies of wealth are unsustainable and incompatible with a healthy climate, and immediate, radical change is required to save the planet from disaster.

Sachin Peddada

Assistant Researcher


This is a part of the AEC Blog series

tags: Sachin-Peddada
Wednesday 05.04.22
Posted by Liz Stanton
 

Formerly Redlined Communities: A Legacy of Harm

Public policy can lead to profoundly positive or negative consequences that carry on for decades, and one primary example of a policy’s lasting impacts is the continuing environmental and public health harm experienced by formerly redlined communities. Redlining began in 1934, as the newly formed Federal Housing Administration (FHA) evaluated mortgage risks for lenders. FHA loan officers followed a grading system developed by the Home Owners’ Loan Corporation (HOLC) in which neighborhoods were rated from A (lowest mortgage risk) to D (highest mortgage risk).

HOLC used race as one of the guiding factors in assigning grades to neighborhoods, as neighborhoods with minority residents were often given the lowest rating and neighborhoods with white residents were given the highest. Minority neighborhoods, particularly Black neighborhoods, were frequently marked in red, representing a D rating. The red markups led to this exclusionary policy’s name: redlining.

Black mortgage applicants were largely denied mortgage loans and lines of credit due to their perceived high risk for defaulting on loans. The blatant racism embodied by this policy led to increasing racial segregation in cities across the country. Since they could not receive loans to move other neighborhoods, especially if it was a highly ranked and/or predominantly white neighborhood, people of color were largely pushed into neighborhoods with low ratings. The policy remained in effect until it was outlawed by the Fair Housing Act of 1968. However, the damage had already been done.

Eighty years later, many formerly redlined neighborhoods continue to experience a disproportionate share of environmental. Among these communities, 74 percent are predominately low to moderate income communities, and 64 percent are predominantly communities of color. Research indicates that the surface temperatures in formerly redlined neighborhoods are warmer than other communities, and they are exposed to higher levels of air pollution than those in neighborhoods previously given high ratings. Economic disparities also negatively impact these communities, as they tend to have lower home values, older housing stock, and lower rents in absolute terms than other neighborhoods. These neighborhoods tend to be located closer to industrial facilities and refineries, exposing them to higher levels of dangerous air pollutants such as nitrogen dioxide and fine particulate matter. New polluting projects, such as highways, were often placed close to, or even ran through, formerly redlined neighborhoods since land in the area was cheap.

The public health risks extend beyond respiratory conditions. Residents of formerly redlined neighborhoods tend to have shorter life spans, higher rates of diabetes, higher rates of hypertension, higher rates of kidney disease, higher rates of poverty than formerly high-rank neighborhoods. Residents are also twice as likely to visit an emergency room for asthma than those in other neighborhoods. One 2020 study found increased rates of premature births in New York City’s formerly redlined communities. Another team of researchers in Massachusetts found that living in formerly redlined neighborhoods posed a heightened risk of being diagnosed with late-stage lung and breast cancer than other neighborhoods and that formerly redlined neighborhood residents experienced a higher risk of late stage diagnoses overall regardless of age, sex, gender, race, or ethnicity.

It is evident that redlining policies implemented almost a century ago continue to impact millions of lives today through exposure to higher levels of pollutants and an increased risk of developing adverse health conditions. The harm caused by high levels of pollutants, and the risk of future harm, falls disproportionately on communities of color and low-income communities in cities around the nation. As the consequences of redlining continue to unfold, policymakers should carefully consider the short-term and long-term impacts on the environment and public health when reviewing existing policies or proposing new ones. Otherwise, policies implemented today risk further harming future generations.

Levi Bevis

Communications Assistant


This is a part of the AEC Blog series

tags: Levi Bevis
Wednesday 04.20.22
Posted by Liz Stanton
 

Zero Headroom for New Coal, Oil, or Gas Resources

On April 4, 2022, the Intergovernmental Panel on Climate Change (IPCC)—the leading world body for the assessment of climate change—released a report called “Climate Change 2022: Mitigation of Climate Change”. The report provides an update on global progress regarding the reduction of greenhouse gases and other mitigation measures that are necessary to avoid the most catastrophic impacts of climate change by limiting average global temperature increase to 1.5 to 2 degrees Celsius (as globally agreed in the Paris Agreement).

Let’s start with the good. The report finds that we already have the technology we need and the know-how to reduce emissions in line with globally-agreed goals: stop burning fossil fuels, deploy renewable energy resources, enhance energy efficiency, electrify heating and transportation, and save more forests. The price of renewable energy has dropped dramatically: between 2010 and 2019, solar and battery costs fell by 85 percent while wind costs fell by 55 percent. The reason for continued fossil fuel production, importantly, is not demand: “people demand services and not primary energy and physical resources per se” (emphasis added), which leads to the amazing conclusion that demand-side strategies could reduce 50 to 80 percent of emissions across all sectors. Some countries are on the right track: at least 18 nations have reduced their total emissions every year for more than a decade. Some of those are making annual emission reductions large enough that—if all other nations followed suit—would be enough to reach globally-agreed average temperature increase goals.

Image reproduced from: https://www.wri.org/insights/ipcc-report-2022-mitigation-climate-change

The not-so-good? The report finds that limiting global average temperature increase to 1.5 degrees Celsius is very unlikely: after the highest global emissions in human history every year for the last ten years, global emissions would need to peak within the next three years (by 2025) and fall by 43 percent by 2030, which would be historically unprecedented. Even then, the IPCC says it is “almost inevitable” that the 1.5 degree warming threshold will be exceeded, at least temporarily. To have any chance of limiting average global temperature increase to 1.5 to 2 degrees, the report emphasizes the need to rapidly phase out fossil fuels: by 2050, coal use must decline by 95 percent, oil use by 60 percent, and gas use by 45 percent. That means some fossil fuel resources would be shut down prematurely—i.e., before the end of their intended lifespan—which also means there is zero headroom for new coal, oil, or gas resources. The conclusion that the only way to limit catastrophic climate change is to ensure that no new coal, oil or gas development takes place has also been reached by the International Energy Agency.

The report’s results are both sobering and uplifting: readily available, affordable technology across the economy can reduce emissions in line with what is needed to avoid catastrophic climate change, but we are headed in the wrong direction. Major political changes are necessary to right our course.

Bryndis Woods, PhD

Senior Researcher


This is a part of the AEC Blog series

tags: Bryndis Woods
Thursday 04.14.22
Posted by Liz Stanton
 

Risks of Investing in Gas Going Forward

Across the United States, utility shareholders are looking to decarbonize their investment portfolios. Influential shareholder groups such as Vanguard, BlackRock, and Goldman Sachs, have signed on to the Net Zero Asset Managers Initiative, an international group of asset managers, that requires signatories to set climate goals in alignment with the Paris Agreement to ensure that global warming is limited to below two degrees Celsius. Signatories to the Net Zero Asset Managers Initiative commit to net-zero greenhouse gas emissions by 2050, as well as to investing in companies that align with this goal. Moreover, in accordance with the Paris Agreement, the Biden administration recently pledged for the United States to transition to a carbon-neutral power sector by 2035 and reach net-zero emissions by 2050.

For shareholders, success in reaching decarbonization goals hinges on how well their investment decisions align with a transition away from carbon-emitting resources. The Climate Action 100+, an investor-led initiative that focuses on ensuring that large corporate greenhouse gas emitters take necessary climate action, sets benchmarks in accordance with the Paris Agreement for climate change governance, emissions reduction, and financial disclosures. The Initiative found in its 2021 study that many utilities are failing to meet these benchmark criteria. Investments in utilities, or utility parent companies, that are still primarily reliant on fossil fuels (e.g., fossil gas, coal or oil) expose shareholders to a range of risks, including increased volatility of gas pricing, more stringent climate regulation, and increased competition with renewable energy.

The United States has become more intertwined with international markets, rendering domestic gas prices susceptible to changes in global gas prices. As a result, gas prices are becoming increasingly unpredictable, particularly in the wake of the COVID-19 pandemic and political conflicts. For example, in February 2020, U.S. natural gas prices were at $2.50 per thousand cubic feet, one year later in February 2021 prices had reached $16.29 per thousand cubic feet, and by March 2021 prices had fallen to $3.40 per thousand cubic feet. This level of unpredictability jeopardizes the profitability of gas plants, which in turn puts stock values—and the shareholder investments they represent—at risk.

Data source: U.S. EIA. 2022. "Henry Hub Natural Gas Spot Price." Available at:  https://www.eia.gov/dnav/ng/hist/rngwhhdd.htm

In addition, stricter climate regulation and increased public sentiment against fossil fuels across the United States have prompted additional scrutiny of utility portfolios. Energy companies with substantial reliance on gas may be significantly impacted by such regulations, such as requirements to reduce carbon emissions or reallocate large amounts of spending toward climate adaptation and mitigation. For example, in New Mexico in 2019, the Senate passed the Energy Transition Act which mandates that electric utilities must only supply carbon-free energy by 2050. This legislation set in motion the premature closure of the San Juan coal-fired power plant, reinforcing the fact that stricter state legislation puts pressure on utilities to transition to clean energy. While this primarily affects ratepayers who see higher energy bills as a result, public opposition that arises from higher bills may generate animosity between investors and the public. The effects of increased public opposition to gas can arise not only in fluctuations of stock value but also in public perceptions of the shareholders that invest in a utility with a gas-heavy portfolio.

Moreover, renewable energy is now competitive with gas generation, making gas expansion a less economically sound expenditure for utilities, and the price of clean energy technologies is still falling. The U.S. Department of Energy has set a goal to considerably reduce the cost of solar for the residential, commercial, and utility sectors by 2030. As renewable energy continues to claim a competitive advantage in the energy market, utilities with a reliance on gas risk falling stock values. Shareholders are then affected by a decrease in stock values, putting their investment decisions at greater risk, particularly if they choose to sell.

Going forward, utility shareholders face important choices in how to balance their investment decisions, particularly those with gas-heavy portfolios. Utility shareholders wanting to decarbonize their investment portfolios must ensure that their client portfolios are aligned with the same goals to minimize the risks involved.

Elisabeth Seliga

Assistant Researcher


This is a part of the AEC Blog series

tags: Elisabeth Seliga
Wednesday 04.13.22
Posted by Liz Stanton
 

Decarbonizing Goals and the Market for Minerals and Metals

Conscious of the urgent impacts of climate change in the United States, President Biden has committed to reducing greenhouse gas emissions by half from 2005 levels by 2030 and reaching net-zero emissions by 2050. The Administration's main policy in support of these climate goals is decarbonizing the transportation and power sectors with the support of more energy storage. Executive Order 14037 requires half of all new battery electric, plug-in hybrid electric, and fuel cell electric vehicles sold nationwide be carbon-free by 2030, and Executive Order 14057 requires federal government procurements to cut all carbon emissions from the electric sector by 2035 and acquire 100 percent zero-emission vehicles by 2027. To fulfill this climate agenda, a substantial increase in non-fuel minerals and metals is needed to manufacture zero-emission vehicles, renewable technologies, and batteries.

The Administration’s initial report on Executive Order 1417 notes that, according to the International Energy Agency:

·       building an electric car requires six times more mineral resources than building a gasoline-powered car, and

·       building an onshore wind power plant requires nine times more minerals than building a gas-fired power plant.

The International Energy Agency has also demonstrated that building batteries requires more minerals than building other energy sources and technologies.

According to Wood Mackenzie, Biden’s decarbonization plan would increase demand for battery supply from the current 46 GWh per year to 600 GWh per year, requiring 13 times the amount of minerals needed today. Examples of minerals that are important for renewable energy include rare earth permanent magnets, cobalt, manganese, lithium, nickel, and graphite for vehicle batteries and grid storage, and gallium for LEDs lights and electronics chips in solar and wind systems. Among rechargeable batteries, demand is highest for lithium batteries because they have the highest overall technical performance: longer lifespan (3,000 charging-discharging cycles) with 80 percent of usable power out of its total energy supply capacity, larger power output per volume, highest energy stored per kilogram of battery, and lighter weight. Crucial raw materials involved in the construction of lithium batteries include cobalt, nickel, manganese, and lithium.

The U.S. ambition to decarbonize its transportation and power sectors by achieving net-zero emissions by 2050 multiplies the demand for zero-emissions vehicles, renewable energy technologies, and energy storage. This increased demand in turn fosters higher requirements for raw non-fuel minerals and metals. For the best chance of success in achieving net zero emissions in the United States, the Biden Administration must take into consideration the market for—and environmental and political concerns related to­­—these raw materials.

Tsanta Rakotoarisoa

Research Assistant


This is a part of the AEC Blog series

tags: Tsanta Rakotoarisoa
Thursday 03.31.22
Posted by Liz Stanton
 

Energy Burdens in the District of Columbia

Within a single town or city, households pay the same energy rates (all residential customers pay the same rate for energy on a per unit basis). However, even for the same size of house or amount of energy use, households with lower incomes spend a larger share of their income on their energy bill than higher-income households do, leaving less for other expenses like rent, healthcare, or college tuition.

Recent research by the American Council for an Energy-Efficient Economy (ACEEE) found that the median energy burden (energy costs as a share of income) in the United States is 3.1 percent: For example, in 2018, the U.S. median income was $62,000; therefore, half of households pay less than $192 and half pay more in energy costs.  

In the District of Columbia, the median energy burden is only 2 percent, but lower-income households pay a lot more. Half of the low-income District households (defined by ACEEE as those which earn less than or equal to 200 percent of the federal poverty level, or $55,500 for a family of four) pay more than 7.5 percent of their income in energy costs (a household making $55,000 annually pays $340 or more per month). One in fourteen of District households are “severely” energy-burdened—meaning they pay more than 10 percent of their income in energy costs.

In 2018, half of all District households made more than $90,600, and half made less. The half that make more than $90,600 pay just 1 percent of their income in energy bills. In contrast, District households earning less than $27,000 per year spend almost 20 percent of their income on energy.

There are also racial/ethnic disparities in energy burdens both in the District and across the United States. According to ACEEE, households of color face higher energy burdens compared to their white counterparts. The inequitable distribution of energy burdens is confounded by several other disparities facing racial/ethnic minority populations. For example, because of historical and systemic racism, racial/ethnic minorities on average earn less income, are less likely to own a home, and have poorer health outcomes.

Most policies to address energy burdens aim to either provide energy bill relief (e.g., the Low-Income Home Energy Assistance Program (LIHEAP) or the Weatherization Assistant Program (WAP)) or rebates for energy efficiency upgrades that reduce energy consumption. For instance, the District‘s Sustainable Energy Utility (DCSEU) offers rebates for the purchase of energy-efficient appliances, making energy savings more attainable for low-income households. More recently, states have started to work towards capping energy burden. For example, New York State developed an initiative called Reforming the Energy Vision (REV), which sets an energy cost target of 6 percent of income for low-income customers. Similar policies exist or are in the works for California and New Jersey.

In our report, Equity Assessment of Electrification Incentives in the District of Columbia, we identify three priorities to ensure equitable decarbonization efforts; one of which is to prevent existing energy burdens from worsening. Addressing disparities in energy burden provides more money to spend on other key expenditures that maintain household’s quality-of-life, such as healthcare, childcare, and college tuition. This increased spending also puts more money into the community, spurring economic growth.

Tanya Stasio

Researcher

Elisabeth Seliga

Assistant Researcher


This is a part of the AEC Blog series

tags: Tanya Stasio, Elisabeth Seliga
Wednesday 03.02.22
Posted by Liz Stanton
 
Newer / Older